How to Build a Sports Betting Model From Scratch
Building a sports betting model isn't magic. It's data collection, cleaning, and calibration. Here's how to start from first principles.
The deal
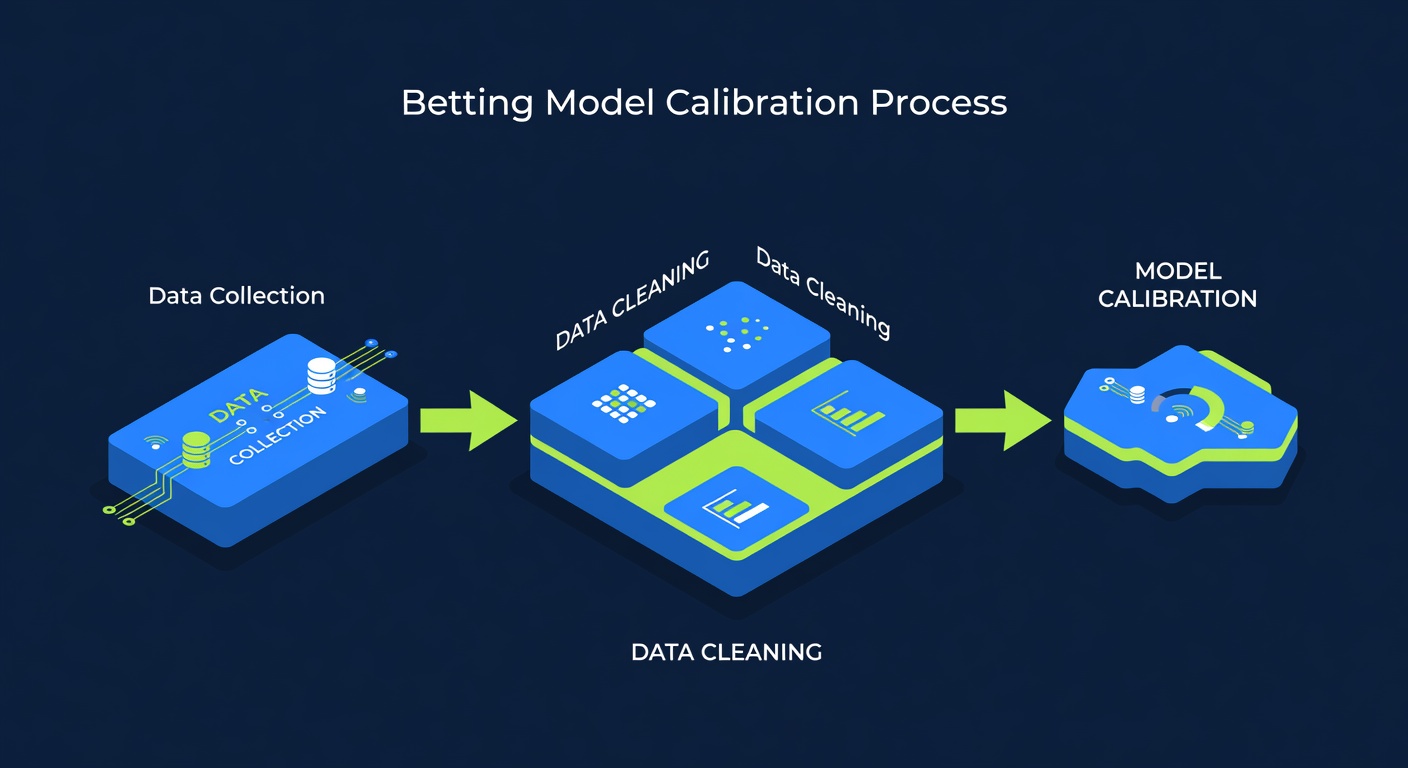
A sports betting model is a system for predicting outcomes and calculating value. To build one, you need data, a framework, and honest testing. I'll walk you through this as a compliance officer would: clearly, methodically, without shortcuts.
Round 1: What You're Actually Building
A betting model is a probability estimator. You're trying to answer one question: What is the true probability that Team A beats Team B? Once you know that, you compare it to the market odds. If the market says Team A has a 45% implied probability and you think it's 55%, you have found value.
DraftKings, Bet365, and every major sportsbook employ mathematicians building models exactly like this. The difference is scale and data access. They have years of data. You're starting from zero.
Round 2: Step 1: Data Collection
You need historical data. For American football: seasonal records, point differentials, rest days, injury reports, home-field advantage data. For soccer: possession statistics, shot location, defensive metrics, manager tenure, transfer history.
Different sports require different data. What matters: collect the same variables for every game in your dataset. Consistency is not optional.
FBRef (Football-Reference) and StatsBomb provide granular sports data. Pro Football Reference has 25 years of NFL statistics. Soccer data is trickier but available through Understat and WyScout.
Start with 3 years of data minimum. Preferably 5-10 years if available.
Round 3: Step 2: Cleaning and Normalization
Raw data is messy. Missing values. Inconsistent formatting. Outliers that seem wrong but aren't.
Normalize everything to a common scale. If you're using yards per game and completion percentage, scale them both to 0-100 or -1 to 1 range. This prevents one variable from dominating just because its raw numbers are bigger.
Handle missing data methodfully. Don't guess. Either exclude those games from your dataset or use statistical imputation (forward fill, backward fill, or mean substitution). Document your choice.
Round 4: Step 3: Feature Engineering
Features are the variables your model uses. Not all of them matter equally. Some are proxies for others.
Examples of useful features:
- Win-loss streak (does momentum exist?)
- Strength of schedule (how hard were the opponent's last 5 games?)
- Head-to-head history (does it predict future matchups?)
- Time since last game (rest advantage)
- Home-field advantage (universal: roughly 2.5-3% win probability boost)
Test each feature independently. Does adding injury data improve predictions? Does including coaching changes? Not all data signals are valuable.
Round 5: Step 4: Model Selection
You have options. Logistic regression (simple, interpretable). Random forest (handles non-linear relationships). Gradient boosting (powerful but easy to overfit).
Start simple. Logistic regression is the industry baseline. It's interpretable: you can see which features matter and by how much.
Once you understand simple regression, move to ensemble methods (combining multiple models). DraftKings' internal models are likely gradient boosted ensembles with thousands of features, but they started where you're starting.
Round 6: Step 5: Training and Testing
Split your data into three sets:
- Training: 60% of your data. You build your model here.
- Validation: 20% of your data. You tune your model (adjusting parameters).
- Testing: 20% of your data. You never touch this until the end.
Your model learns from training, gets optimized on validation, and proves itself on testing. This prevents overfitting (your model memorizes the training data instead of learning generalizable patterns).
Round 7: Step 6: Calibration
Your model outputs probabilities. But are those probabilities accurate?
If your model says Team A has a 70% chance to win, do they actually win 70% of the time in your test set?
Plot your predicted probabilities against actual outcomes. If there's a gap, you need calibration. Common methods: Platt scaling or isotonic regression.
Round 8: Step 7: Comparison to Market Odds
Once your model is trained and calibrated, compare its predictions to actual sportsbook odds. DraftKings, Bet365, and other sportsbooks use similar models. If your model agrees with theirs, you're probably not finding value.
Value exists where you disagree significantly (by more than the vig). If DraftKings says -110 (implied 52.4% probability) and your model says 58%, you've found a potential edge.
But test this. Backtest your picks against historical odds. Do you actually win at the rate your model predicts?
Round 9: Step 8: Risk Management
A good model with bad bankroll management still fails. Size your bets according to Kelly Criterion: Bet = (Probability x Odds - 1) / (Odds - 1).
Never bet your entire bankroll on one game. Never chase losses. Never increase bet size just because you're winning.
Round 10: The Hard Truth
Sportsbooks employ PhD mathematicians. They have more data than you. They have access to injury information in real time. They move odds based on steam (sharp money arriving).
You can't beat them long-term at scale. But you can find small edges in specific sports, specific matchups, specific conditions. Start there. Test brutally. Accept that most models don't work.
The advantage goes to patient builders with honest testing practices.
End of story
Scenes in this story